I have been putting solar panels on things since I was a student. In 2022, when Sri Lanka was running thirteen-hour power cuts and the queue for a litre of petrol was longer than the working day, I built a small off-grid setup to keep a laptop, a router and a few lights alive — I wrote that one up in Powering through Power Cuts SL-2022, and before that I had even built a 12V panel from scratch in Home-made Mini 12V Solar Panel. Those were survival projects. A 50W modified sine wave inverter and a car battery do not pay anything back; they just stop the house going dark.
This post is about the opposite kind of project. In 2025 I put a real 8 kW grid-tied system on the roof at Borella, and the only question that mattered was financial: at what point does this thing stop being an expense and start being an asset? The system has now been running for fourteen months. I have a full year of generation data and fifteen months of CEB bills, which is enough to stop guessing and start calculating.
It is not paid back yet. This is the one-year checkpoint.
What I Actually Bought
I went with Hayleys Solar, the renewable arm of Hayleys Fentons. They are the largest solar EPC in the country with over 150 MW of rooftop installed, and for something that is going to be bolted to my roof for thirty years I wanted a company that would still exist in year ten to honour a warranty. The quote came in on 2 April 2025 under reference REF25031011.
The system is:
14 × JA Solar 595 W panels — JAM72D40 MB, n-type bifacial double glass modules from the Deep Blue 4.0 line, 23.0% module efficiency
8.33 kWp DC array feeding an 8 kW AC three-phase SolaX string inverter with MPPT, rated at 98% maximum efficiency
Balance of system — Alumex mounting, Siechem DC cable, Kelani AC cable, Phoenix Contact surge protection, ABB MCBs, Eaton/ABB isolators
CEB approvals and the net accounting connection, handled by the installer
Warranties: 12 years product and 30 years linear performance on the panels, 10 years on the inverter
Now the part that I think is worth being honest about, because nobody in Sri Lanka talks about it openly. The quote's list price was LKR 3,780,000. Against that sat a "standard discount" of LKR 1,955,000, a "Valentine's discount" of LKR 335,000, and an "additional discount" of LKR 90,000, landing at a final investment of LKR 1,400,000. That is 63% off a list price that, as far as I can tell, no human being has ever paid. The list price is a negotiating instrument, not a price. If you are getting a solar quote here, treat the headline number as fiction and look only at the bottom line — and get three of them.
What I actually paid out on 26 July 2025, including the CEB connection charges that the quote explicitly excluded, was LKR 1,403,435.95. That is the number every calculation in this post runs against.
How the Money Works: Net Accounting
Sri Lanka offers three schemes, and the one you pick decides your entire payback model. Net metering banks your surplus units against future consumption but never pays you cash. Net plus pays you for every unit generated and bills you for everything you consume, separately. Net accounting — which is what I am on — sits in between: you are paid a flat rate for every unit you export, and your imported units are offset against those earnings.
My export rate is LKR 27.06 per kWh, locked from 27 June 2025 to 27 June 2035. Ten years, no escalation. That fixed rate is the single most important number in the whole exercise, and I will come back to why it cuts both ways.
The practical consequence is that the house now has two parts of the CEB account that bill each month. One account is the ordinary household meter. Another account is the net accounting meter that the solar feeds, and it carries the export register, the import register and the export earnings. They describe different halves of the same month and they are not interchangeable — it took me a while and one wrong spreadsheet to work that out.
So the return splits into two components, and both are real money:
Cash from CEB for exported units, which arrives in my bank account roughly two months after the bill, less a Rs 82.05 set-off for the net meter's own monthly charge.
The import bill that never gets charged. Because my exports comfortably exceed my imports, the units the house pulls back off the grid at night are wiped out against the export earnings. In Sep 2026 that was 262 units which, run through the domestic tariff slabs, would have cost LKR 16,550.
That second component is the one people forget, and it is more than a third of my total return so far.
How I Measure It
None of this analysis would exist if I were reading PDFs by hand. Two of my own applications do the collection, which I have written about before.
Tower, my home server dashboard, has a solar worker that reads the daily SolaX report emails out of Gmail, parses the yield and stores it, then pulls matching shortwave radiation and sunshine-hour figures for Colombo so I can compare what the roof produced against what the sky offered. That is where the 436 days of daily generation data in this post comes from. I covered the Gmail-reading side of Tower in Tower Part 2.
FinanceTracker handles the money. It reads the CEB bill alert emails, follows the ebill link, pulls the export and import register deltas out of the PDF, computes what the imported units would have cost under the current tariff slabs, and then auto-links the CEB payment to the matching bank statement line when it lands. I never type a payment in by hand, which means the "received" figures below are bank reality rather than my own bookkeeping.
Year One: Did It Generate What They Promised?
The quote promised 949.62 kWh per month in the first year. That is the number I was most sceptical about, because it is the number that sells the system.
Over the first full twelve months — 28 July 2025 to 27 July 2026, 365 days — the system produced 11,192.9 kWh, an average of 932.7 kWh per month. That is 98.2% of what was quoted.
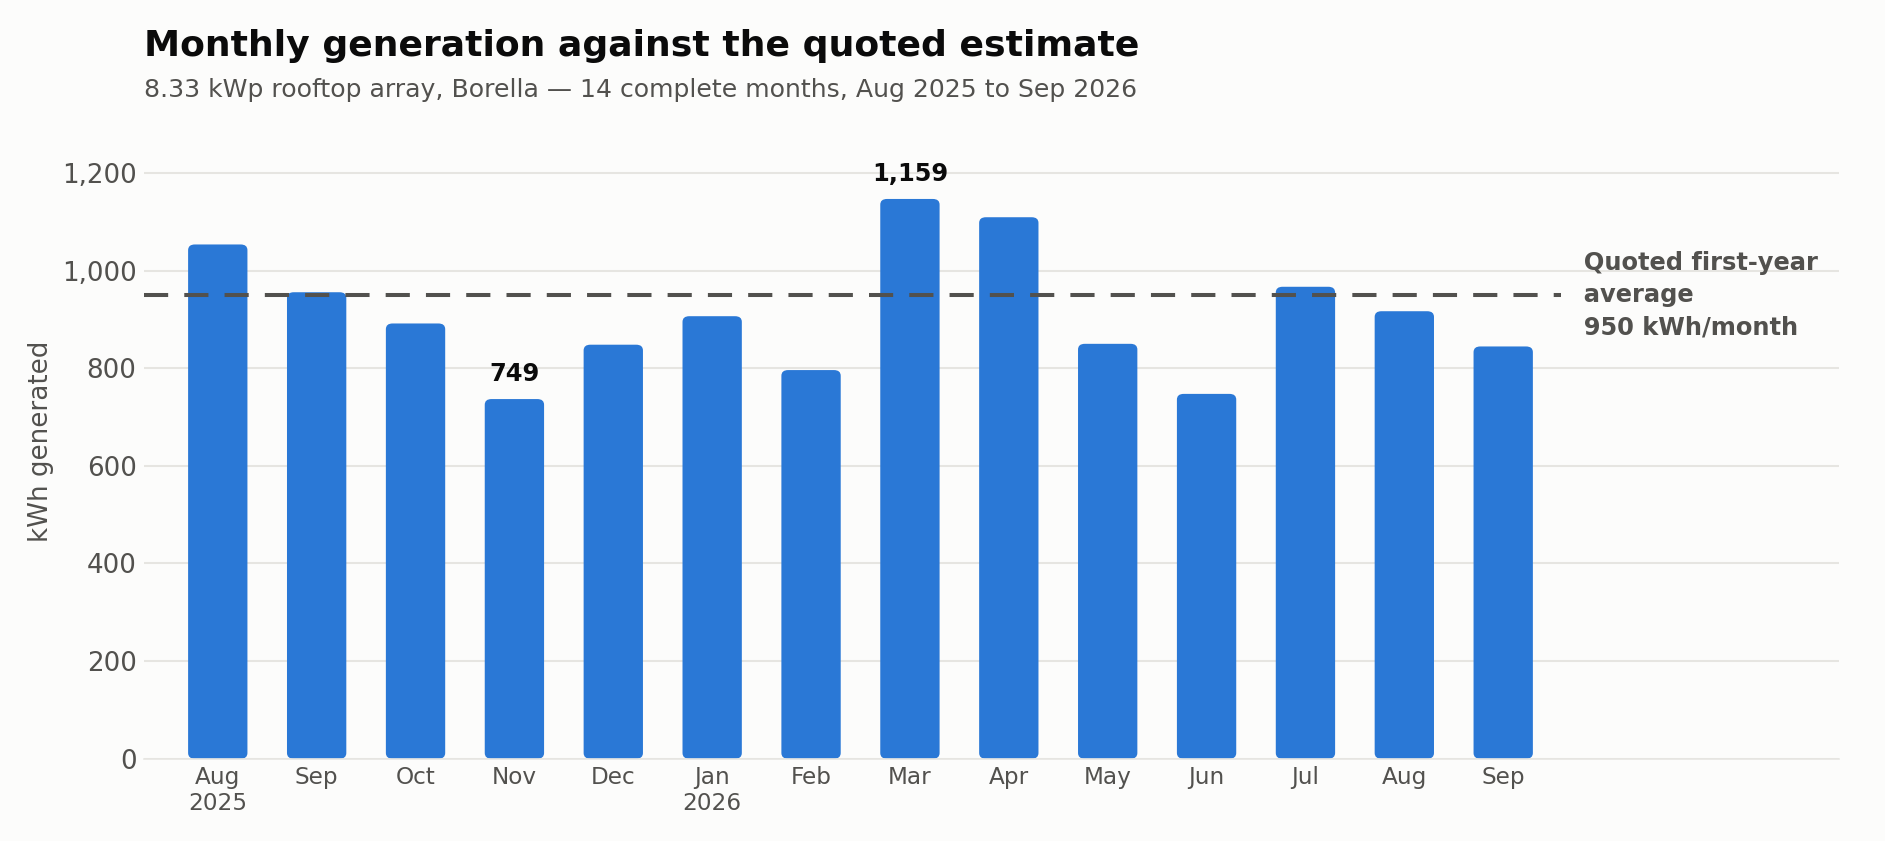
I did not expect that. Every commissioning estimate I have ever seen in any industry is optimistic, and I had mentally discounted the figure by 15% before signing. Hayleys' estimate was essentially correct. Out of fourteen complete months, five beat the quoted monthly figure and nine fell short — the chart below shows the spread, which is exactly the distribution you would expect from an honest annual average rather than a sales number.
In specific-yield terms that is 1,344 kWh per kWp per year against the 8.33 kWp DC array, or 1,399 kWh per installed kW against the 8 kW inverter. For a fixed rooftop array in Colombo with no tracking and no cleaning regime beyond the monsoon, that is a respectable figure.
As of 6 October 2026 the array has produced 13,317 kWh across 436 days, averaging 30.5 kWh per day.
The Shape of a Sri Lankan Solar Year
The monthly spread is wider than I expected, and it does not follow the simple "dry season good, wet season bad" story:
Best month: March 2026 at 1,158.6 kWh, with April 2026 right behind at 1,121.2 kWh
Worst month: November 2025 at 748.6 kWh, 35% below March
Best single day: 49.8 kWh on 26 April 2026 — the four best days of the entire period are all in April
Worst single days: 4.5 kWh, hit twice, on 14 May 2026 and 24 September 2026
21 days out of 436 produced under 15 kWh — call it one bad day in twenty
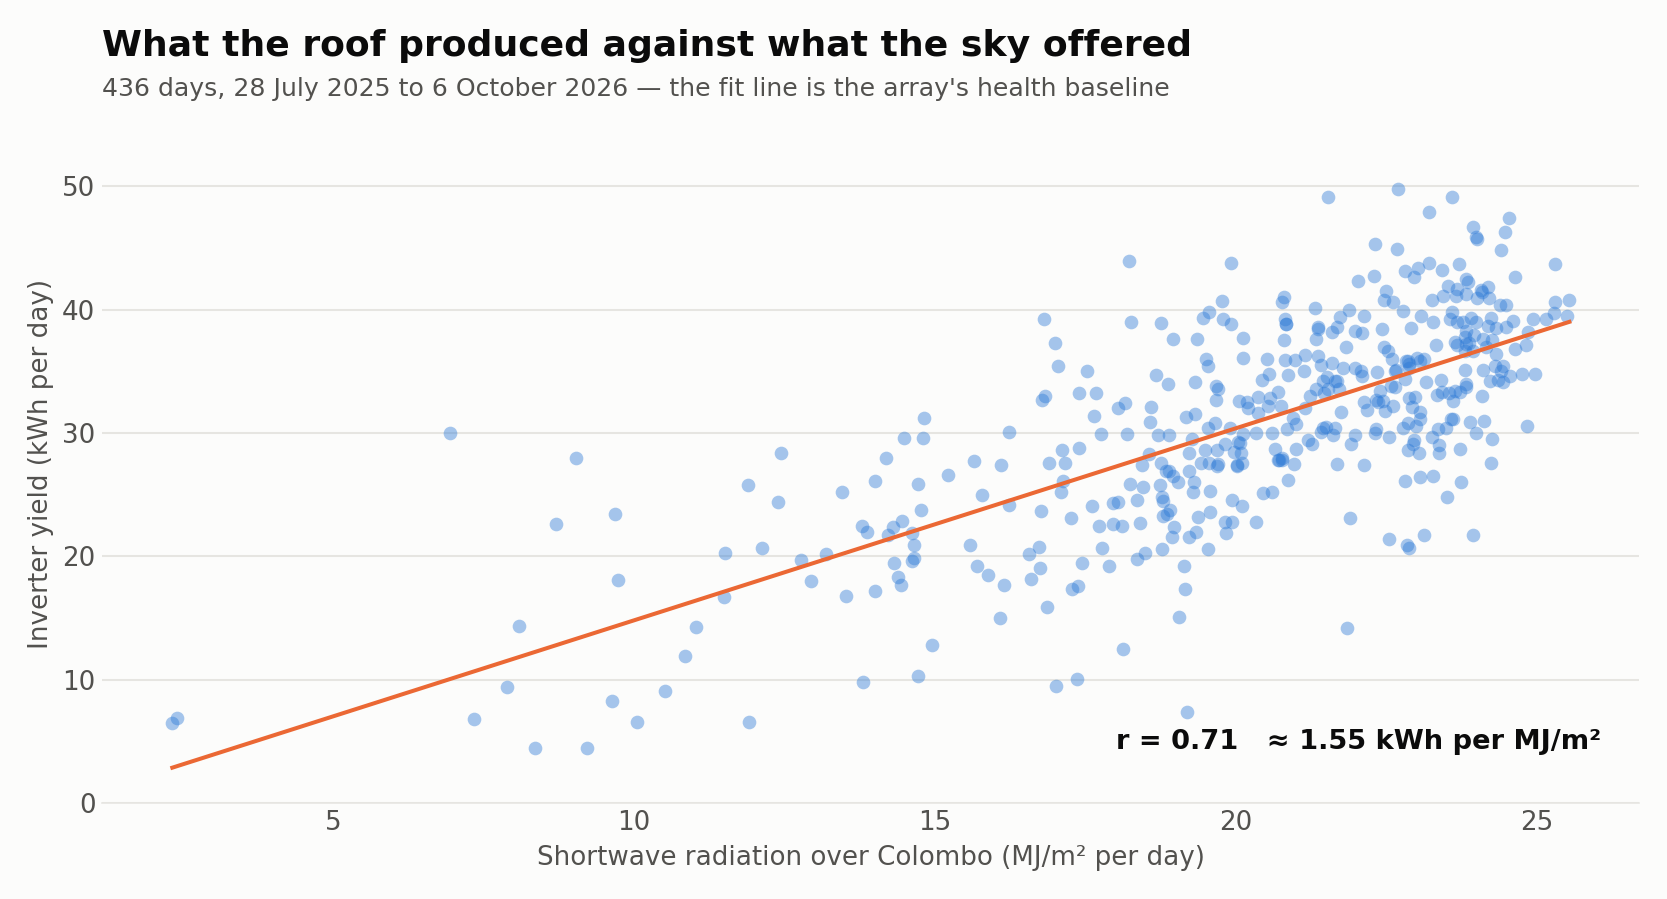
Plotting every one of those 436 days against the shortwave radiation recorded over Colombo gives a correlation coefficient of 0.714, with the roof turning roughly 1.55 kWh out of every MJ/m² that lands on it. That correlation is good enough to be useful as a health check: if yield drops away from the irradiance line, something is wrong with the panels rather than with the weather. So far it has not.
The inverter has thrown exactly three alarms in fourteen months, all of them "Zero power time 1h" — 14 May 2026, 4 August 2026 and 15 August 2026. No service calls, no faults, no intervention. For a piece of power electronics sitting in Colombo humidity, that is a good record.
The Numbers
Here is every billed month since commissioning. Generation comes from the inverter, the export and import units come off the CEB net accounting bill, and the last column is what those imported units would have cost at the domestic tariff had net accounting not wiped them out.
Month | Generated (kWh) | Exported (kWh) | Imported (kWh) | Export earnings (LKR) | Import bill wiped (LKR) |
|---|---|---|---|---|---|
Jul 2025 | 155.2 (4d) | 0 | 0 | 0.00 | 0.00 |
Aug 2025 | 1,065.4 | 0 | 0 | 0.00 | 0.00 |
Sep 2025 | 967.5 | 1,224 | 178 | 33,121.44 | 6,932.00 |
Oct 2025 | 903.5 | 734 | 193 | 19,862.04 | 8,125.00 |
Nov 2025 | 748.6 | 584 | 202 | 15,803.04 | 8,890.00 |
Dec 2025 | 860.0 | 561 | 173 | 15,180.66 | 6,712.00 |
Jan 2026 | 918.4 | 609 | 170 | 16,479.54 | 6,580.00 |
Feb 2026 | 808.0 | 718 | 87 | 19,429.08 | 3,480.00 |
Mar 2026 | 1,158.6 | 683 | 132 | 18,481.98 | 4,908.00 |
Apr 2026 | 1,121.2 | 786 | 317 | 21,269.16 | 18,665.00 |
May 2026 | 861.8 | 785 | 246 | 21,242.10 | 14,950.00 |
Jun 2026 | 759.2 | 524 | 189 | 14,179.44 | 9,250.00 |
Jul 2026 | 978.7 | 479 | 201 | 12,961.74 | 10,450.00 |
Aug 2026 | 928.6 | 569 | 253 | 15,397.14 | 15,650.00 |
Sep 2026 | 856.4 | 683 | 262 | 18,481.98 | 16,550.00 |
Total | 13,091.2 | 8,939 | 2,603 | 241,889.34 | 131,142.00 |
Two things in that table need explaining. The 1,224 units billed in September 2025 are not one month — that is the first bill, covering everything from commissioning on 26 July through to the first meter reading, which is why August 2025 shows generation but no export. And the import bill column jumps sharply from April 2026 onwards, which is not my consumption changing but the tariff changing underneath it.
The May 2026 Tariff Revision
On 11 May 2026 the CEB domestic tariff was restructured, and it materially changed the value of the second half of my return. The old structure had a LKR 2,100 fixed charge and five slabs; the new one has a LKR 2,500 fixed charge and two:
Units | Old rate to 10 May 2026 (LKR/kWh) | New rate from 11 May 2026 (LKR/kWh) |
|---|---|---|
0 – 60 | 14.00 | 32.50 |
61 – 90 | 20.00 | |
91 – 120 | 28.00 | |
121 – 180 | 44.00 | |
Above 180 | 85.00 | 100.00 |
Fixed charge | 2,100.00 | 2,500.00 |
The headline looks like a cut for heavy users — the old top slab was 85 and the new one is 100, but you only reach it after 180 units at 32.50 instead of climbing through four slabs. For me the effect is that every unit I avoid importing is now worth more at the low end and roughly the same at the high end, which quietly improves my payback. That is worth saying out loud: rising grid tariffs make a solar investment pay back faster, and my export rate is fixed while the tariff I am avoiding is not.
Where the Investment Stands
There are three honest ways to count what has come back, and the answer moves by nine percentage points depending on which you pick. I am showing all three because the difference is the interesting part.
Basis | Recovered (LKR) | % of LKR 1,403,435.95 | Projected breakeven |
|---|---|---|---|
Cash in the bank only — 10 CEB payments received | 192,951.25 | 13.7% | — |
All export earnings billed, paid or not | 241,889.34 | 17.2% | Jul 2032 |
Cash received + import bills wiped | 324,093.25 | 23.1% | Sep 2030 |
All earnings + import bills wiped | 373,031.34 | 26.6% | Jan 2030 |
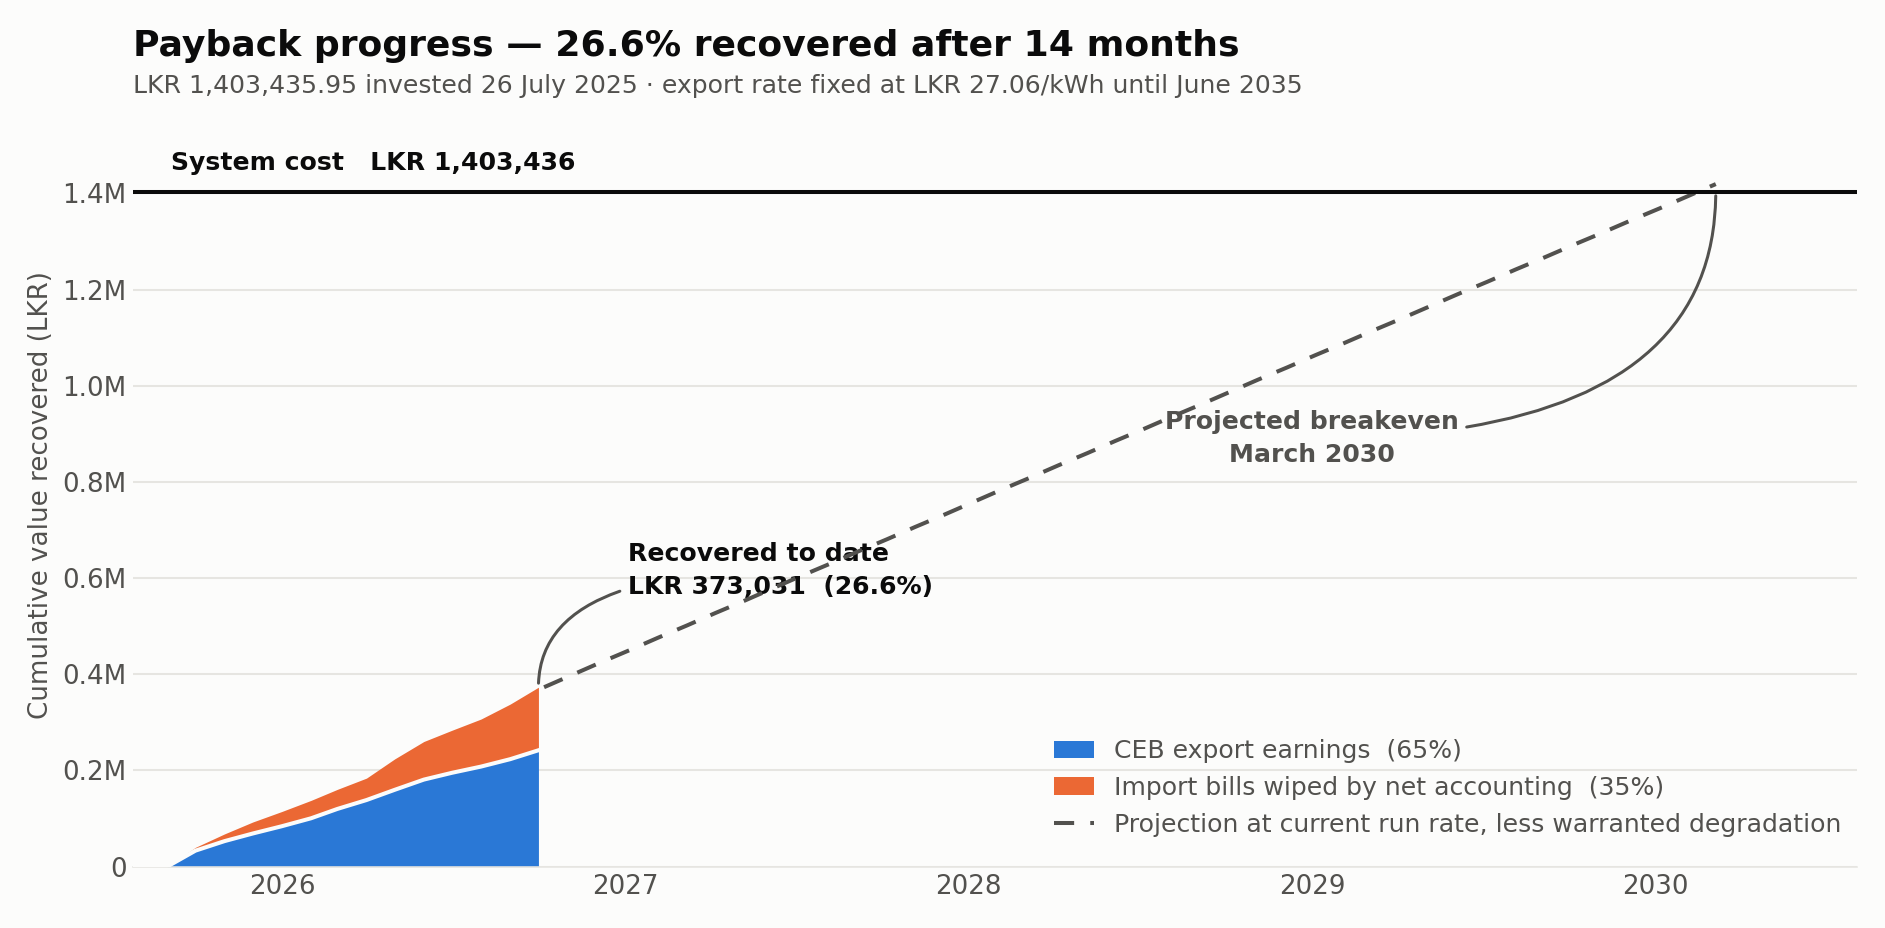
I use the last line as my headline, because it counts everything the system has actually earned me whether or not CEB has got round to paying it yet. On that basis the system has returned LKR 373,031 in fourteen months and is 26.6% paid back.
The gap between the first and last rows is worth understanding. LKR 48,938 is billed and sitting in CEB's pipeline — three months of bills from July, August and September 2026 that have not been paid out yet. CEB is consistently about two months behind, and I have never had a payment fail to arrive, so I am comfortable counting earned rather than received. The other LKR 131,142 is the import bills that net accounting erased, which is money I did not spend rather than money I received, but it leaves my pocket in exactly the same way.
For the record: 8,939 kWh exported, 2,603 kWh imported, and roughly 4,378 kWh — about a third of everything generated — consumed in the house directly without ever touching the meter.
Extrapolating to Payback
Fourteen months is 1.20 years, and it spans a complete seasonal cycle including both monsoons, so the run rate is reasonably trustworthy rather than a lucky summer.
At LKR 373,031 over 1.20 years, the system is returning LKR 311,778 per year, or LKR 25,981 per month. There is LKR 1,030,405 still to recover. Straight-line, that is 3.30 more years, putting breakeven at January 2030, roughly 4.5 years from installation.
Straight-line is too generous, though, because panels degrade. The JA Solar warranty curve specifies 1% degradation in the first year and 0.4% per year thereafter over thirty years. Applying that curve pushes breakeven out to March 2030, about 4.6 years from installation. Degradation turns out to be almost irrelevant over a payback this short — it costs me two months. It matters far more over the thirty-year life than over the first five years.
The assumptions behind that projection, stated plainly so they can be argued with:
Generation holds at the current run rate, adjusted only for the warranted degradation curve. No cleaning improvement, no shading from a neighbour's new upper floor, no inverter replacement.
The export rate stays at LKR 27.06 — which it must, because it is contractually locked until June 2035, well past the projected breakeven. This is the assumption I am most confident about.
The domestic tariff stays where the May 2026 revision put it. If it rises, I pay back faster. If it falls, slower. Historically in Sri Lanka it has not fallen for long.
My consumption pattern stays roughly as it is. A change here — an EV, an air conditioner, anyone working from home — shifts the split between exported and self-consumed units and therefore shifts the maths.
No major failure. The inverter carries a 10-year warranty and would be the thing to go first; a replacement after that would be a real cost, but it falls outside the payback window.
The most interesting consequence of a 4.6-year payback is what sits behind it. The export contract runs to June 2035. At the current run rate the system generates about LKR 3.12 million of value across the ten-year contract — 2.2 times what it cost — and then carries on producing for another twenty years under warranty, at whatever rate the scheme offers in 2035. That second-contract rate is the real unknown in the thirty-year picture, not degradation and not the weather.
Was It Worth It?
On the evidence so far, yes, and more clearly than I expected when I signed the quote.
The thing I got most wrong was my own cynicism about the generation estimate. I assumed the quoted 949.62 kWh per month was a sales figure and discounted it; it came in at 98.2%. The thing I underestimated was how much of the return would come from avoided import bills rather than export cash — that component is LKR 131,142 of LKR 373,031, over a third, and it is invisible if you only look at the money landing in your bank account. Anyone evaluating a solar quote on export earnings alone is undercounting their return by a third and will talk themselves out of a good investment.
The thing I would still flag to anyone considering this in Sri Lanka is the fixed export rate. LKR 27.06 for ten years is a good rate today. It is a rate with no inflation protection in a country that has had plenty of inflation. The hedge is that the tariff you avoid by self-consuming does move with inflation, so the more of your own generation you use rather than export, the better protected you are. If I were sizing this again I would think harder about shifting load into daylight hours rather than simply maximising export.
The current position, at fourteen months: LKR 1,403,435.95 invested, LKR 373,031.34 returned, 26.6% recovered, and a projected breakeven of March 2030.
I will post an update when it crosses 50%, which on the current run rate should be around August 2027. By then I will have two and a half seasonal cycles of data and the projection will be worth considerably more than it is today. The data is collected automatically now, so the only work left is the writing.